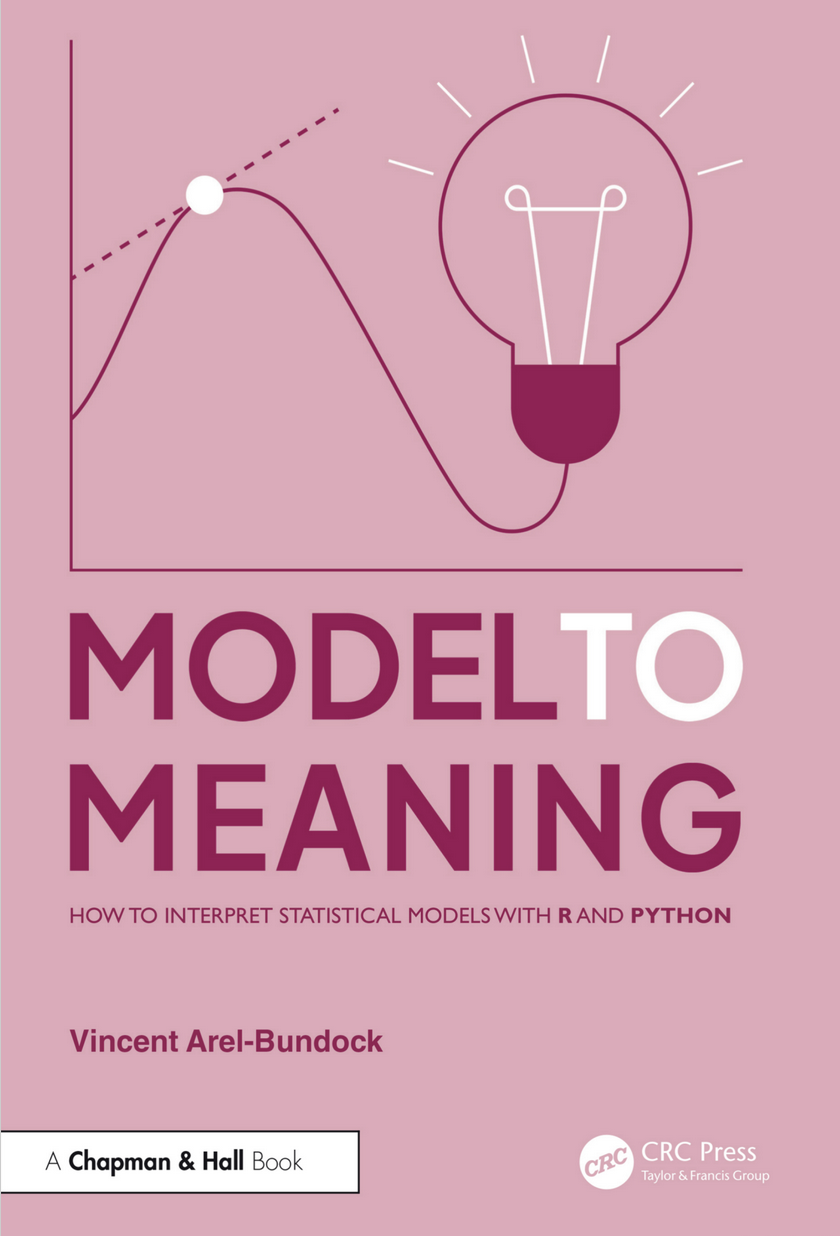
Model to Meaning
How to interpret statistical models with marginaleffects for R and Python

How to Interpret Statistical Models
With marginaleffects for R and Python


Our world is complex. To make sense of it, data analysts routinely fit sophisticated statistical or machine learning models. Interpreting the results produced by such models can be challenging, and researchers often struggle to communicate their findings to colleagues and stakeholders. This page is designed to help you overcome these challenges.
The marginaleffects.com website hosts the code and documentation for the open source marginaleffects package. This software empowers R and Python users to translate the outputs of statistical and machine learning models into accurate insights that are accessible to a wide audience.
Reading material
Readers who seek a short introduction can read the Quick Start vignette or the marginaleffects article in the Journal of Statistical Software (open access).
In addition, this website hosts a free HTML version of this book:
Model to Meaning: How to interpret statistical models in R and Python. Arel-Bundock, Vincent. 2026. CRC Press.
The full R scripts to run the examples in the book can be downloaded by clicking here. The full Python code viewed here.
I (Vincent) pledge to give all author royalties from sales of this book to the Native Women’s Shelter of Montreal and the Against Malaria Foundation. If you choose to read the free version, please consider sending a donation to one of these organizations. And if you do that, send me a quick note; it’ll make my day!
Software
The book and article present a simple but powerful conceptual framework to help analysts make sense of complex models. They also offer detailed tutorials on marginaleffects, a free software library for R and Python. marginaleffects offers a single point of entry to easily interpret the results of over 100 different types of statistical and machine learning models in R and Python.
- Powerful: It can compute and plot predictions; comparisons (contrasts, risk ratios, etc.); slopes; and conduct hypothesis and equivalence tests for over 100 different classes of models in
R. - Simple: All functions share a simple and unified interface.
- Documented: Each function is thoroughly documented with abundant examples. The marginaleffects.com website hosts a free textbook with several thousands of words of tutorials and case studies.
- Efficient: Some operations can be up to 1000 times faster and use 30 times less memory than with the
marginspackage.
- Valid: When possible, numerical results are checked against alternative software like
Stataor otherRpackages. - Thin: The
Rpackage requires relatively few dependencies. - Standards-compliant:
marginaleffectsfollows “tidy” principles and returns simple data frames that work with all standardRfunctions. The outputs are easy to program with and feed to other packages likeggplot2ormodelsummary. - Extensible: Adding support for new models is very easy, often requiring less than 10 lines of new code. Please submit feature requests on Github.
- Active development: Bugs are fixed promptly.
Citation
To cite marginaleffects in publications use:
Arel-Bundock V, Greifer N, Heiss A (2024). “How to Interpret Statistical Models Using marginaleffects for R and Python.” Journal of Statistical Software, 111(9), 1-32. doi:10.18637/jss.v111.i09 https://doi.org/10.18637/jss.v111.i09.
A BibTeX entry for LaTeX users is
@Article{,
    title = {How to Interpret Statistical Models Using {marginaleffects} for {R} and {Python}},
    author = {Vincent Arel-Bundock and Noah Greifer and Andrew Heiss},
    journal = {Journal of Statistical Software},
    year = {2024},
    volume = {111},
    number = {9},
    pages = {1--32},
    doi = {10.18637/jss.v111.i09},
}